
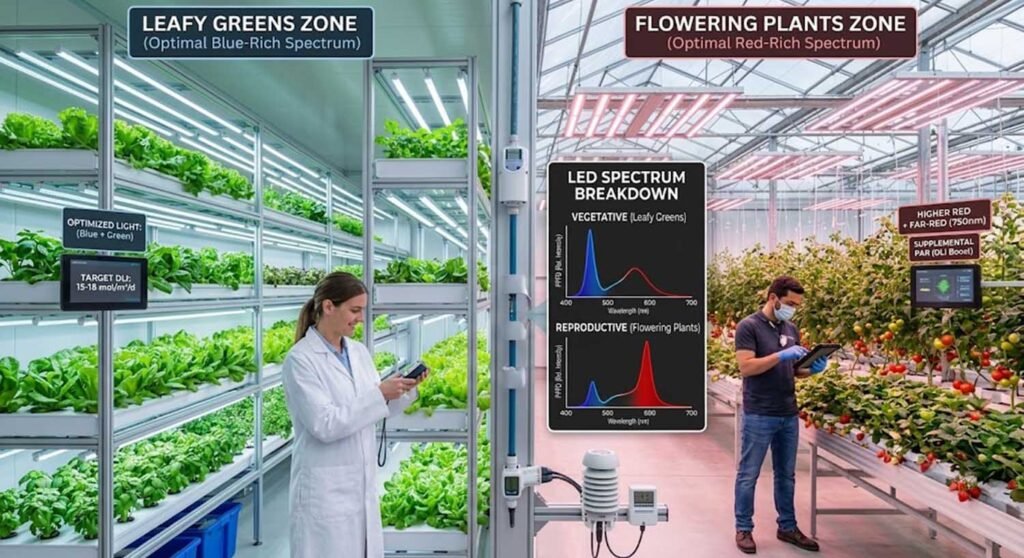
Best LED Spectrum for Leafy Greens: Requires a Blue-Rich Full Spectrum (450nm Blue at 15% - 25%, 660nm Red at 40%, and Wide rest spectrum at 35% - 45%) designed to trigger cryptochromes, suppress apical dominance, and deliver compact biomass. Target PPFD: 150 - 250 μmol/㎡/s.
Best LED Spectrum for Flowering Plants: Requires a Red-Rich Dynamic Spectrum (660nm Deep Red at >60%, coupled with 730nm Far-Red at 5% - 10% for phytochrome photoconversion, and traces of UV-A) engineered to drive generative steering and maximize sink-organ carbohydrate allocation. Target PPFD: 600 - 1500 μmol/㎡/s.
The Paradigm Shift: Beyond the Chlorophyll Absorption Fallacy
For decades, Controlled Environment Agriculture (CEA) infrastructure blindly relied on the classic McCree Action Spectrum and in-vitro chlorophyll a/b absorption peaks, which isolate absorption heavily in the narrow 430nm blue and 660nm red bands. This primitive understanding birthed the first generation of narrow-band "Blurple" (pink/purple) LED grow lights.
Modern commercial facility engineering has moved past this biological oversimplification. In a real-world dense canopy, plants do not rely solely on isolated chlorophyll molecules; they utilize a sophisticated, interconnected antenna complex of accessory pigments, including Carotenoids, Phycobilins, Cryptochromes, and Phytochromes.
Furthermore, advanced plant physiology has transitioned from the traditional definition of PAR (Photosynthetically Active Radiation, 400–700nm) to ePAR (Extended PAR, 400–750nm). Photons in the 700–750nm far-red spectrum, previously dismissed as photobiologically inert, actively work synergistically with shorter-wavelength photons through the Emerson enhancement effect to drive Photochemical Quantum Yield.
Industrial-grade spectral engineering is no longer about mimicking the sun or matching an artificial curve. It is about sculpting the spectral valleys to maximize net photosynthetic efficiency per watt while maintaining a highly workable indoor environment.
Leafy Greens: The "Compact Architecture & Biomass Acceleration" Formula
Leafy greens - such as culinary herbs, loose-leaf lettuces, and microgreens - operate under a vegetative-dominant metabolic blueprint. Spectral engineering here focuses heavily on morphogenic control and rapid vegetative cell division.
VEGETATIVE BALANCED SPECTRUM
450nm Blue (High Ratio) ──► Activates CRY1/CRY2 ──► Inhibits Inter-node Elongation (Compact Architecture)
550nm Green (Mid Ratio) ──► Deep Canopy Penetration ──► Drives Understory Photosynthesis (Prevents Tip-Burn)
Photomorphogenesis Under Blue Photons (450nm) & Cryptochrome Activation
Blue photons at 450nm directly stimulate plant Cryptochromes (CRY1, CRY2) and phototropins. This chemical activation actively suppresses elongation by regulating auxin transport and gibberellin sensitivity.
By maintaining a high blue ratio (15% - 25%), commercial indoor vertical farms eliminate "legginess" (stretching). This ensures tight inter-nodal spacing and dense, compact leaf rosettes. For facility operators, this architecture perfectly matches the ultra-tight vertical clearances of automated multi-tier racking systems, maximizing total harvestable biomass per cubic meter of real estate.
The Green Photon Paradox (530–560nm): Deep Canopy Penetration
While green photons have a lower absorption coefficient on an isolated, single-leaf surface, they possess superior transmittance and reflectance properties within a dense crop canopy.
In commercial multi-tier lettuce beds, high-flux red and blue photons are completely captured by the upper canopy layer, creating severe shading effects. Green photons, however, bounce between leaf layers and penetrate deep into the understory leaves. This drives uniform photosynthesis throughout the entire vertical profile of the plant, eliminating water-logged, chlorotic lower leaves, boosting single-plant gram weights, and maintaining stable, uniform transpiration that significantly lowers the incidence of Tip-Burn (calcium deficiency).
Secondary Metabolites & Flavor Mapping (The Pre-Harvest Flush)
Manipulating the spectrum during the final 72 to 96 hours before harvest triggers defensive metabolic pathways. By spiking blue wavelengths and introducing minor UV-A (385–400nm) bands, plants accelerate the accumulation of Anthocyanins, Phenolics, and Flavonoids to protect their tissues from light-induced oxidative stress.
In commercial terms, this spectral shift turns standard green cultivars into premium, deep-crimson red cultivars (e.g., Red Oakleaf lettuce) and spikes volatile oil synthesis in culinary herbs like Basil. This produces the sharp, pungent aromatic profile required to win premium wholesale supply contracts with high-end grocery and restaurant networks.
Flowering & Fruiting Crops: The "Generative Steering & Sink-Source Optimization" Engine
High-energy flowering crops like strawberries, vine tomatoes, and peppers demand a highly dynamic, multi-channel approach. The lighting environment must transition from building a structural "source" (leaves) to continuously packing carbohydrates into a harvestable "sink" (fruit).
GENERATIVE SPECTRUM TIMELINE
Phase 1: Propagation ──► High Blue (450nm) ──► Stout Stems, Expansive Root Architecture
Phase 2: Flower Induct ──► Shift R:FR Ratio ──► Photo-Equilibrium Pfr Transition ──► Synchronized Blooming
Phase 3: Fruit Ripening──► Blast Red (660nm) ──► Hyper-PPFD Conversion ──► Brix Accumulation via UV-A
Generative Steering via Phytochromes (The R:FR Interplay at 660nm & 730nm)
Flowering crops monitor their physical environment through the Phytochemical Equilibrium (Pf / Ptotal) of their phytochromes. Phytochromes continuously alternate between two states: Pr (inactive form, absorbing 660nm deep red) and Pfr (active form, absorbing 730nm far-red).
By precisely engineering the Red to Far-Red ratio (R:FR), commercial growers can steer flowering genes (FT genes). Introducing an engineered pulse of far-red (730nm) at specific vegetative transitions simulates a subtle shade-avoidance response. This re-allocates carbohydrates away from structural leaf development and directs it into early floral node formation, shortening the total time-to-first-harvest by up to 14 days in commercial tomato operations.
Photon Density Saturation Curves & High PPFD Delivery
Unlike leafy greens, which experience a low Light Saturation Point (LSP) around 250 μmol/㎡/s before plateauing., high-wire fruiting crops exhibit an expansive linear photosynthetic response up to 1000 - 1200 μmol/㎡/s before plateauing.
Delivering this immense volume of light requires high-power, industrial 640W to 1000W+ top-lighting setups. To control ongoing operational costs, the spectrum must be heavily weighted toward 660nm Deep Red>60% - 75%). This weighting is critical because AlInGaP (Aluminum Indium Gallium Phosphide) 660nm red diodes offer the highest Wall-Plug Efficiency and photon output per watt (μmol/J) of any semiconductor color band, ensuring that hitting a high Daily Light Integral (DLI) does not bankrupt the facility on utility tariffs.
Ultraviolet (UV-A 395nm) as an Enzymatic Catalyzer for Sugar (Brix)
Integrating a controlled, low-flux channel of UV-A (395nm) during the fruit-set and ripening phases alters the plant's enzymatic activity. It upregulates Sucrose Phosphate Synthase (SPS), a core enzyme governing carbohydrate translocation into fruit tissues.
This spectral intervention eliminates the flat, "watery" taste often associated with winter hydroponic greenhouse produce. It elevates the Brix index of the fruit by 1.5 to 2.5 degrees, transforming standard greenhouse harvests into premium-tier, high-fructose produce that easily clears the rigorous quality thresholds of premium cold-chain distributors.
The Industrial Matrix: Cross-Comparing Engineering & Financial Specifications
To seamlessly integrate lighting infrastructure into facility design, agricultural engineers and EPC contractors must evaluate how biological spectrums translate directly into electrical, optical, and thermal system loads:
| Engineering Specification | Leafy Greens Optimized Spectrum | Flowering/Fruiting Optimized Spectrum |
| Spectral Anatomy Breakdown | 450nm Blue (20%) | 660nm Red (40%) | Rest wide spectrum (40%) | 450nm Blue (10%) | 660nm Red (75%) | 730nm Far-Red (5%) | Rest wide spectrum (10%) |
| Average Fixture Efficacy | 2.3 - 2.7 μmol/J (Higher phosphor-conversion loss across broad spectrum) | 2.8 - 3.5 μmol/J (Driven by highly efficient, un-phosphored monochrome 660nm diodes) |
| Target Delivery (PPFD) | 150 - 250 μmol/㎡/s | 600 - 1500 μmol/㎡/s (Supplemental to DLI) |
| Thermodynamic Footprint | Distributed low-heat profile; optimal for tight microclimates. | Intensive high-heat concentration; requires aggressive upward airflow. |
| Hardware Form Factor Compatibility | Thin, low-profile linear bars for multi-tier racks with <40cm clearances. | Heavy-duty, high-bay top-lighting grow lights for greenhouse trusses. |
The Financial Drain of "One-Size-Fits-All" Compromise Spectrums
Many facility procurement teams select generic, fixed, mid-range "white" full-spectrum fixtures to simplify initial capital expenditure (CapEx). While this strategy looks clean on an initial purchasing ledger, it introduces severe, ongoing operational inefficiencies (OpEx Drain) across both crop categories:
The Leafy Green Financial Bleed: Red Over-Saturation
When a multi-tier leafy green facility runs a generic spectrum built with excessive 660nm red, the operator pays a high utility rate for photons that actively degrade the crop's market value. Over-saturation of red photons on loose-leaf lettuce species suppresses proper lateral leaf expansion and induces premature bolting (flowering) and edge-burn. The leaves grow elongated, fibrous, and bitter. The farm expends expensive electrical energy only to harvest a lower-grade product with a shortened shelf life.
The Fruiting Crop Financial Bleed: Red Starvation
Conversely, hanging that same generic white fixture over a commercial strawberry or high-wire tomato row starves the crop of essential generative triggers. Because standard wide-spectrum white diodes lack the intensive photon momentum of dedicated 660nm deep red and 730nm far-red bands, reproductive receptors remain under-stimulated. The real-world consequence is a high rate of flower abortion (dropped blossoms), delayed fruit color transition, and flat brix profiles, reducing total marketable fruit yields by up to 30%.
The HVAC & Microclimate Synergy: Calculating the Thermal Spectrum Penalty
Lighting arrays represent the primary sensible heat load inside closed CEA environments. The chosen spectrum directly impacts the design, sizing, and run-hours of the facility's HVAC (Heating, Ventilation, and Air Conditioning) systems.
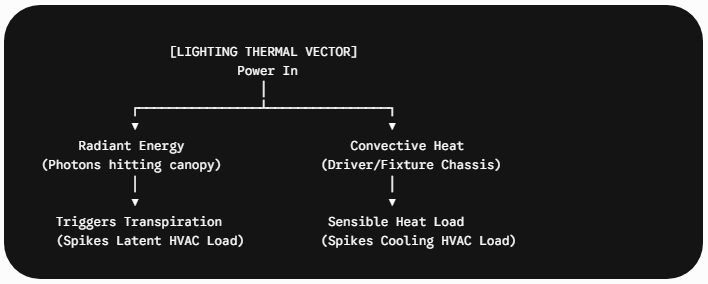
A red-heavy, high-efficacy spectrum (3.5μmol/J) converts more electricity into usable light and less into direct convective chassis heat. However, when these intensive photon densities (>800μmol/㎡/s) hit a fruiting canopy, they drive up the internal leaf temperature via radiation.
This thermal energy forces the crop into an intensive transpirational cycle to cool its own tissues, rapidly transforming the room's sensible heat load into a massive latent heat load (humidity). If the HVAC system is not engineered to handle this high latent conversion rate, the room's vapor pressure deficit (VPD) collapses. This stagnation stalls nutrient uptake, encourages fungal pathogens, and overloads air conditioning compressors, wiping out any energy savings achieved by the lights alone.
Conclusion
Infrastructure lighting decisions made during the initial facility blueprint stage lock in operational margins for the next decade. Choosing a compromised spectrum inevitably leads to compromised yields, elevated energy bills, and unstable microclimates.
Contact our senior agricultural engineering team today. Provide our laboratory with your facility’s CAD layouts, ceiling heights, electrical parameters, and target crop yield goals. We will generate a complimentary, industrial-grade DIALux PPFD distribution map, comprehensive thermal load estimates, and a tailored spectral mapping configuration engineered to maximize your facility's long-term commercial valuation.
FAQ
Q1: How does spectral selection affect the physical design of the secondary optics (lenses), and why does it matter for multi-tier uniformity?
- A: Different wavelengths of light (photons) travel through optical materials at different refractive indices - a physics principle known as chromatic aberration. Blue photons (450nm) bend more sharply than red photons (660nm). The Engineering Solution: If a manufacturer uses a cheap, generic clear plastic lens over a dynamic LED array, the red and blue photons will separate as they leave the fixture. This creates "spectral banding" on the plant canopy, where the center of the tray receives too much red and the outer edges receive too much blue. To prevent this unmarketable crop non-uniformity, industrial-grade horticultural lights must utilize custom-engineered diffusive secondary optics or specialized beam-shaping matrix lenses (e.g., 90° or 120° asymmetric distribution). This ensures that every millimeter of the leaf canopy receives a perfectly homogenized, pre-mixed light recipe, maintaining identical growth rates across the entire multi-tier rack.
Q2: Why must a facility's photoperiod (day length) be dynamically synced with the chosen spectral recipe for leafy greens vs. flowering crops?
- A: Photoperiod and spectrum cannot be engineered in isolation; they are governed by the plant’s daily light integral (DLI) matrix. Leafy greens have a lower light saturation point but can tolerate a continuous 18 to 24-hour photoperiod under a blue-rich full spectrum, compressing their growth cycle into fewer calendar days. The Fruiting Trap: Flowering plants, however, are strictly bound to photoperiodic triggers controlled by their phytochromes. For example, commercial short-day strawberries require a hard drop to a 10 to 12-hour photoperiod to initiate heavy flowering. If you maintain a long photoperiod while blasting fruiting red spectrum, the plant ignores the spectrum and remains in a vegetative loop. Therefore, commercial environmental control software must run integrated scheduling where photoperiod length decreases as red/far-red spectral intensity increases, guaranteeing successful generative steering without burning excessive grid power.
Q5: How does the sulfur or pesticide spraying schedule inside a commercial greenhouse impact the selection of the LED spectrum's outer packaging?
- A: In commercial cultivation, vaporized sulfur or chemical pesticides are frequently deployed to combat powdery mildew and pests. These chemical agents contain high concentrations of sulfur and chlorine, which are highly corrosive to exposed electronics. The Spectral Degradation Risk: Standard LED diodes use silver (Ag) coatings inside their lead-frame packages to maximize light reflection and photon extraction efficiency. When sulfur vapor penetrates a cheap light fixture, it reacts with the silver to form Silver Sulfide (Ag₂S), turning the reflective sub-layer black. This chemical reaction permanently alters the emitted spectrum, rapidly killing the critical 660nm red output and dropping fixture efficacy by up to 40% in less than a year. Commercial bids for humid, spray-heavy environments must mandate fixtures featuring IP65 waterproof ratings sealed with optical-grade silicone potting or conformal glass coatings to physically isolate the semiconductor chips from ambient chemical corrosion.
I really appreciated the explanation of why leafy greens need a blue-rich spectrum. Understanding how cryptochromes influence growth and help suppress apical dominance makes it much clearer why those specific light ratios are important. It’s a helpful reminder that spectrum tuning can have a big impact on plant structure and compactness.
Thank you so much for your kind words – your comment really makes us feel the article was worth writing. Have you encountered similar situations in your own growing or research practice? We'd love to learn from you. We will also continue to share useful insights based on our research.